

To access the diagnostics, go to Toolbox --> Diagnostics node.
The diagnostics feature allows you to see all the most recent events that occurred on the PBX. You can filter the events by different parameters (e.g. Id, entity, description). You can also access the log files by clicking on ‘go to log files’.
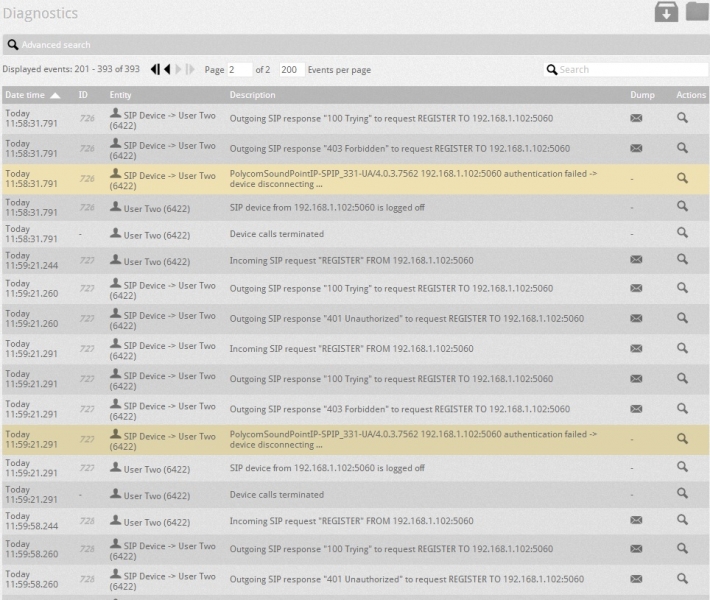
You can download the diagnostic files by clicking on the Export diagnostic icon ![]() or by clicking on the Go to log files icon
or by clicking on the Go to log files icon ![]() .
.
You can quickly debug problems and misconfigurations by setting the parameters in the Advanced search section. Advance search section searches the diagnostic against the set up parameters which helps to isolate the problem.
See below for the possible parameters:
| Parameter | Use |
| Level | Allows you to select the level of messages to be displayed.
|
| Type | Allows you to filter the type of interaction you want to debug.debug. Following types are as follows:
|
| ID | Allows you to filter the information for a specific call ID. |
| Entities | Allows you to filter out the information for a particular entity system. Following entities are as follows:
|
| Description | It allows you to look inside the packet dump, the search mode is text based which allows you to search for information in the package directly. |